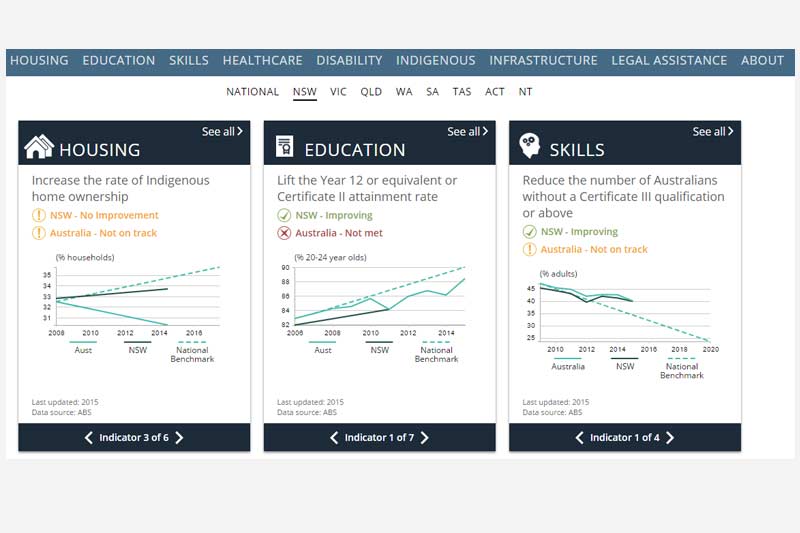
Image: Screenshot from Performance Dashboard
The Department of Premier and Cabinet (DPMC) in Australia has launched a Dashboard to track the joint performance of all Australian governments, in collaboration with Data61, the data innovation agency of CSIRO. The Dashboard, currently in beta, contains assessments of progress at the national level,as well as the state and territory levels.
Policy responsibility for each indicator may lie with the states and territories, or with the Commonwealth, or be shared. Assessments for a state or territory are for residents of that state or territory, and do not necessarily reflect the performance of the state or territory government, as the Commonwealth may share policy responsibility. Similarly, results at the national level do not necessarily reflect the performance of the Commonwealth government. The allocation of policy responsibility for each service area is detailed in the Report on Government Services.
As part of the decision to abolish the Council of Australian Governments (COAG) Reform Council, the DPMC was assigned interim responsibility for performance reporting. The Performance Dashboard will now provide a single, streamlined source of information on progress towards COAG’s key commitments, replacing the COAG Reports on Performance that were released on an annual basis. From 2017-18, responsibility for the Performance Dashboard will transfer to the Productivity Commission.
The Commonwealth, States and Territories have agreements across a range of areas including healthcare, education, disability, water, transport, infrastructure and housing. The Dashboard provides a high-level overview of performance in achieving key COAG commitments in priority areas.
The Dashboard includes performance benchmarks from the six National Agreements, which cover healthcare, education, affordable housing, skills and workforce development, disability and Indigenous reform. Multiple indicators are tracked under each of these areas. For instance, there are 8 indicators under housing, such as 'Reduce rental stress', 'Reduce homelessness' and ' Increase the rate of indigenous home ownership'.
The Dashboard also includes an assessment of progress under a small number of the most significant National Partnership Agreements.
The data used comes from a variety of surveys, administrative collections and censuses. A significant portion of the data is also published in the annual Report on Government Services (RoGS) by the Productivity Commission.
If there are multiple data sources that could be appropriate measures for a benchmark or indicator, the Dashboard’s analysis and figures concentrate on the main measure, as agreed by jurisdictions. Supplementary data sources are sometimes included in the supporting commentary, particularly where they are more up to date.
Most of the available data covers the period from 2008 to 2015. Typically the baseline year for assessment is 2008. This was the year prior to the current Federal Financial Relations Framework, and the six National Agreements, coming into effect. All data are current as of March 2017.
Survey data is tested for statistical significance of differences and changes are only noted when differences are statistically significant.
Assessments vary based on whether COAG has agreed to reach a particular benchmark by a particular point in time, or whether it has agreed that performance should be monitored, but has not set particular benchmark for achievement. The table below outlines the range of assessments based on type of indicator. The complete details of the range of assessments based on type of indicators in two categories mentioned above can be found here.


