As the world becomes increasingly interconnected and systems increasingly complex, using technologies built to leverage relationships and their dynamic characteristics is imperative. Today’s businesses are faced with extremely complex challenges and opportunities that require more flexible, intelligent approaches.
Enterprise graph framework for data scientists aims to improve predictions that drive better decisions and innovation. Neo4j for Graph Data Science incorporates the predictive power of relationships and network structures in existing data to answer previously intractable questions and increase prediction accuracy.
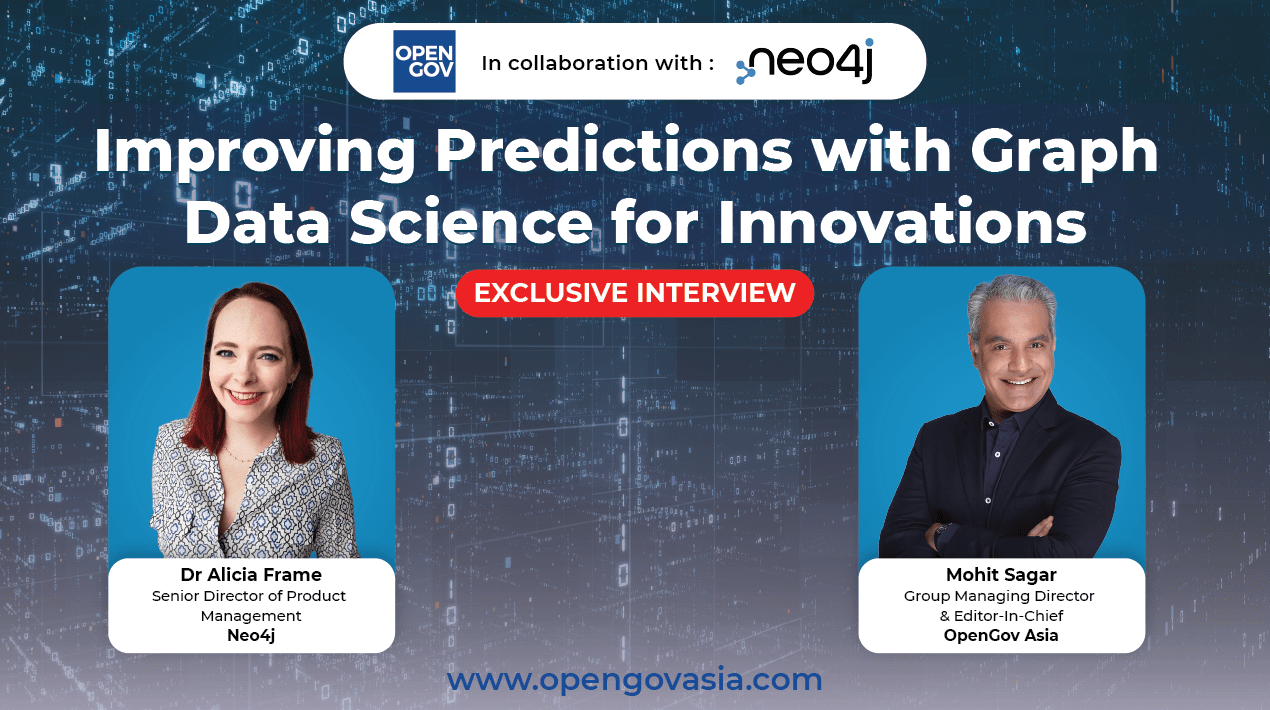
 OpenGov Asia had the opportunity to speak with Dr Alicia Frame, Senior Director of Product Management at Neo4j, to gain her insights on Graph Data Science.
Alicia is Neo4j’s lead for everything Graph Data Science – working closely with engineering to build a world-class platform for connected data science, collaborating with customers and practitioners to understand how graphs can be put to practical use, and educating the data science community on the power of connections.
Neo4j is a graph company that is all about determining connections within data to derive information. Without finding connections, data in and of itself may not have actionable meaning. Organisations need connections to make sense of otherwise isolated data points.
Alicia differentiates a database platform from a data science platform. In a database, organisations can store their data and they can query important things and look for those. Data science is about leveraging the connections amongst billion or even trillion data points. Graph for data science is leveraging those connections to figure out what is important and meaningful.
Industry’s Requirements for Leveraging Data
There are three main requirements. First, as organisations have more data, the speed of the ability to access, retrieve and interpret data becomes important; whether it is the speed of the query or how fast the algorithm works.
The second thing is expressiveness. The more data there is, the more important it is that the data represent something meaningful. In a context of a graph, organisations need to structure data the same way it is represented in real life.
The final point is, the more data organisations have, the harder it is to know exactly what to look for in a data set. Having the tools to search the important patterns become crucial. Hence, the end-users can focus their value on what is important instead of spending years sifting through useless information.
In OpenGov Asia’s conversation with Nik Vora, Vice President, Asia-Pacific, he explains that graph technology is important because it can extract the inherent value in the data itself. The purpose of the technology is to store information without restricting it to a pre-defined model.
Alicia agrees with this. A Graph Data Platform does not only represent individual data points but all of the connections between them. Storing data traditionally could lose that critical part of the information, such as the relationship between two people or items. Graph Data Platform faithfully represents the data; the relationships and connections are retained. When organisations access the data via a query or a machine learning model, they are still capturing the kernel of meaning in there without throwing any important information.
Graph Data Science
Graph Data Science is about letting the connected data speak for itself. It could be running an unsupervised method of graph algorithm to find the signal in the noise. Based on how the data is connected, these nodes and concepts are most important.
It could also be based on the customer graph to show how the community of customers interact and the information is useful for segmentation.
Organisations could go a step further by doing supervised machine learning on the graph. This way, they can predict how the graph is going to change in the future. Graph Data Science lets organisations learn from the structure of the graph – not just the people they are connected to, but the whole graph. It predicts what relationship is going to form next. It is all about going from what to know to look for to surfacing what is important and unusual to then predicting the future and what is going to change.
Knowledge Graph in Graph Data Science
Dr Maya Natarajan, Senior Director, Knowledge Graphs, Neo4j believes that knowledge graphs are immensely useful for organisations to solve their business challenges. She says that a knowledge graph is unique because of semantics. Semantics is one of the key components and advantages of knowledge graphs.
Semantics are encoded alongside the data in the graph itself. This is how knowledge graphs drive intelligence into data and significantly enhance its value. Essentially, knowledge graphs increase the value of data through semantics by adding more context.
Knowledge graphs are often implemented as the first phase in Graph Data Science. Alicia thinks of a Knowledge Graph as a heterogeneous graph or a graph that different types of nodes, such as people, places and things.
Step one of doing Graph Data Science is having a graph. The vast majority of Neo4j’s customers start with a Knowledge Graph to know what information they have, how it is related to other concepts and how it is connected to their business problems.
Once they build a Knowledge Graph, doing Graph Data Science is about figuring out what problems they are trying to solve, what questions they want to ask and how they turn everything they know into accurate predictions.
Moving from Reactive to Predictive Models
Businesses often start in their reactive phase. For example, organisations only look up fraud when it has already happened and find out who commits fraud. Alicia thinks that this approach is useful but limited because, in the end, the goal is to prevent fraud instead of catching the fraudsters.
When it comes to predictive value, it means learning the kinds of patterns that predict a certain outcome. In the future, organisations can know the patterns of certain features to derive accurate predictions.
Alicia offers the example of predictive modelling by mentioning a large global pharmaceutical company. The company has an electronic medical record. They were able to say for every patient that they have data on, this is the sequence of events that they observe in their healthcare journey. They had all of the connected data in a graph.
What they are interested in doing is taking that data and learning from that information: who looks like someone who will benefit from certain interventions? Who benefits from this drug? And who would benefit from this drug in the future? Then they know what the graph pattern looks like for someone who will benefit from the drug. They can also find people with similar characteristics and give early interventions to improve patients’ outcomes.
In closing, Alicia says that she has used Neo4j for over 10 years. Neo4j is the first Graph Data Platform that was out there. and beyond a doubt, Neo4j was the first Graph Data Science Platform. Layering on top of the strong fundamentals of a database, there is a super-powerful enterprise-scalable data science platform.
Neo4j has tested products on tens of billions of nodes to make sure their algorithm will finish, give the right answer and be easy to use. When organisations combine a mature long-standing database product with innovative data science, they will get all of the predictive capabilities combined with the ability to process them. Neo4j meets the bar for maturity, scalability, speed and future completeness.
For more information visit https://neo4j.com/product/graph-data-science/
