
The growing potency in an Enterprise AI Platform combined with Graph Data Platform is successfully enhancing machine learning models and ultimately tackling empowering decision making effectively. Undeniably, both technologies work hand-in-hand to make data relationships simpler by being scalable, performant, efficient and agile.
From tracing connections via complicated social networks to comprehending interconnections, Graph Data Platform databases with Enterprise AI Platform have proven to be an excellent tool for data management in real-time. The most evident advantages of Graph Data Platform were seen during the current pandemic when governments needed to track down community infections.
Graph Data Platform aids governments in making data-driven, intelligent decisions. Additionally, it prevents fraud and potential information leaks that have mushroomed disproportionally with the rapid COVID-driven digitalisation.
The added agility that Enterprise AI Platform and Graph Data Platform offers makes it clear that the combination should be the preferred decision-making methodology. Further, an Enterprise AI Platform along with a Graph Data Platform has proven to be cost-effective for the government.
In times of crisis, obtaining information in real-time has become critical for decision-making. With a Graph Data Platform that is integrated with an Enterprise AI Platform, information can be structurally arranged quickly, analysed to draw conclusions that can influence decision-making and drive change. These powerful capabilities are the missing link for government to drive actionable outcomes from data.
The pandemic heralds an age where digital transformation in public sectors must take centre stage if governments want to be able to lead and navigate citizens through increasingly complex times. An enhanced machine learning model is the key to helping government agencies build intelligent applications that traverse today’s large, interconnected datasets in real-time. The copious volumes of data that organisations generate and collect need to be analysed and interpreted if they are to streamline government methods in forecasting and serve policymakers in effective decision-making.
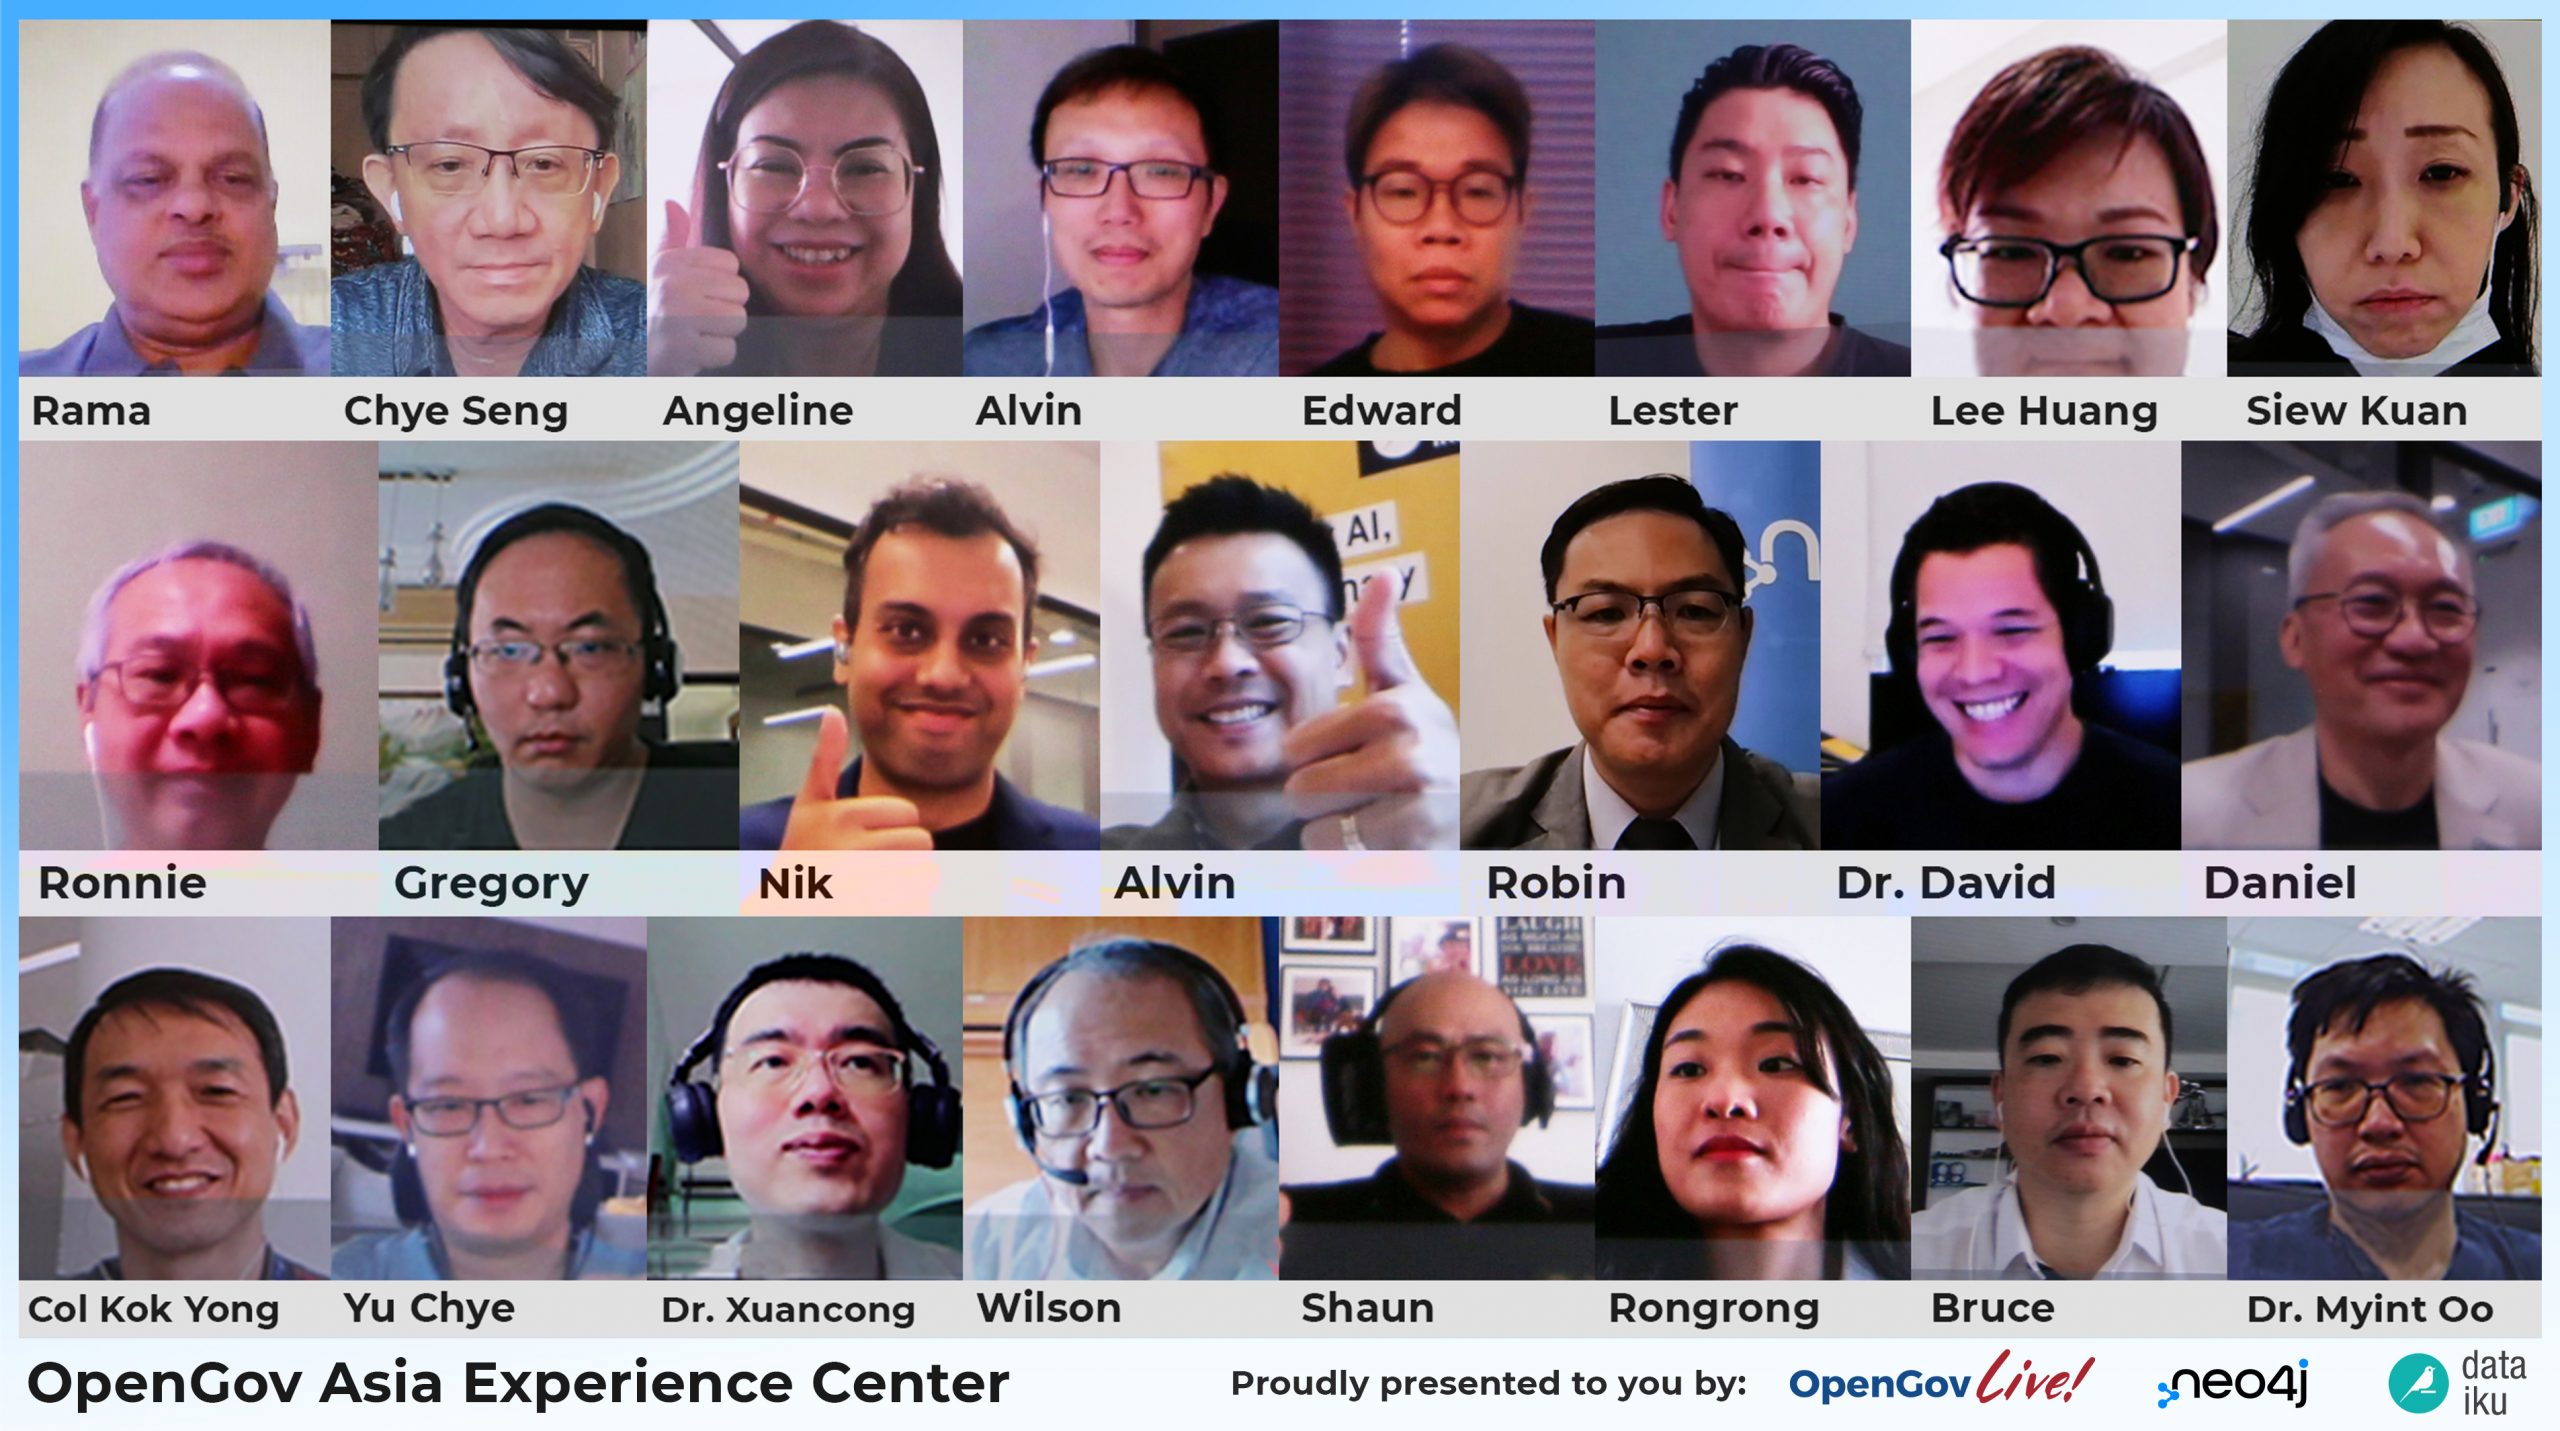
The main inquiry of OpenGovLive! Virtual Breakfast Insight was centred on the use of Graph Data Platform and Enterprise AI Platform to generate deep insights for incisive decision-making. This was a closed-door, invitation-only, interactive session with top-level executives from Singapore public sector.
Tackling complex challenges in the public sector through Enterprise AI Platform and Graph Data Platform

Mohit Sagar, Group Managing Director and Editor-in-Chief, OpenGov Asia, kicked off the session with his opening address. The world has fundamentally changed, and the challenges of these times will require sophisticated solutions that will be critical for decision-making in real-time. Without a doubt, technology is a priority, Mohit asserts.
Governments across the world are looking for excellent tools for data management in real-time that can provide insights into data, Mohit acknowledges. The growing potency in an Enterprise AI Platform combined with Graph Data Platform has been proven to strengthen machine learning models and address complex decision making effectively, making it an ideal tool.
In Mohit’s opinion, Singapore is in its infancy when it comes to the adoption of AI technology. “Where does Graph Data fit in if there are already enough tools we are using for AI?” he asks. For him, there is a gap between good to great and that it is the combination of these technologies – AI and Graph Database – that makes the difference.
Graph Data Technology, Mohit firmly believes, is an eventuality; organisations will need it at some point. “You are going to absorb the technology in the future – it is here to stay,” he contends.
AI and Data Graph technology complement the Singapore government’s initiative to make data relationships simpler by being scalable, performant, efficient and agile. Mohit acknowledges that the Singapore government has already begun its drive towards a digital government, harnessing AI and Graph Databases to curb Covid in Singapore. Citing the current examples and practices of AI and Data Graphs, Mohit elaborated on the tremendous benefits and practicalities of these combined technologies.
Singapore has been doing well in utilising insights to inform decision-making. One of the most obvious use cases for graphs is contact tracing for COVID-19 infections. Since COVID-19 proliferates through social interactions, graphs are perfectly suited to helping scientists and policymakers expose and understand connected data – from tracing connections through complex social networks to understanding dependencies between people, places, and events.
He urged the agencies represented at the session to recognise the need to elevate the technology that organisations are using. Mohit reminded the delegates of the complexity of the challenges besetting the world today. Against this backdrop, it would be wise for delegates to partner with experts to better place themselves to respond with agility and efficiency in a rapidly evolving world.
Transforming collected data to connected data with Graph technology

Robin Fong, Regional Director – ASEAN, Neo4j, spoke next on the uses of Graph Database technology and how it can springboard agencies in their alignment with the priority of the Singapore government.
Whether it is humans or AI, “context is key in decision-making,” Robin argues. Making decisions require going beyond the numbers to understand relationships. Humans make tens of thousands of decisions daily, most of which depend on perceptions of surrounding circumstances.
Similarly, machine learning and AI need to be able to access and process a great deal of contextual and connected information, so it can learn from adjacent information, make judgements and adjust to circumstances.
As data is everywhere, the first step is collecting it – data ingestion. This is the acquisition and transportation of data from assorted sources to a storage medium. The next level is in providing deeper context and moving beyond merely collecting data to connecting the dots.
For business leaders to decide swiftly, they require the maximum amount of context they can gather through technology. “Our challenge is to make context practical and actionable for humans, automated processes and AI.”
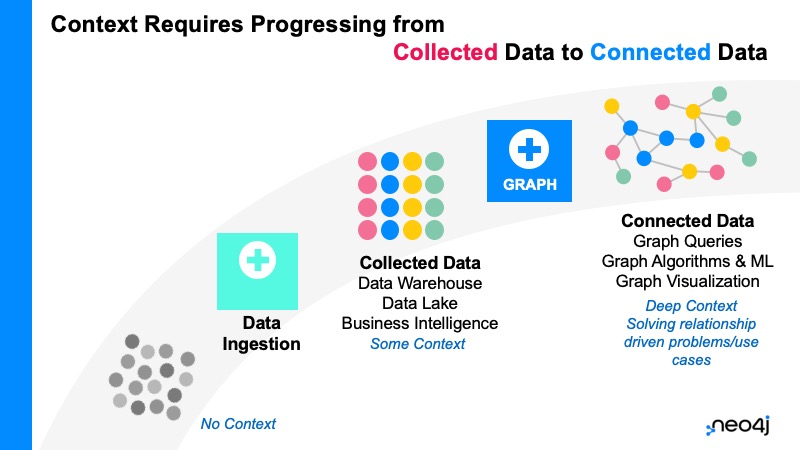
Where Neo4j’s graph technology gives an edge is in producing deep context through processing collected data to connected data. “How do you solve deep problems with deep relationships?” Robin asks
If organisations can combine data, semantics and a graph structure, they will end up with a knowledge graph that has dynamic and very deep context because it is built around connected data.
Neo4j is the creator of the Property Graph and Cypher language at the core of the GQL ISO project. With thousands of Customers World-Wide, Neo4j is headquartered in Silicon Valley and has outposts in Singapore, Indonesia China, Australia, India and Japan.
Graph technology is extremely versatile and can elevate the capability of companies and agencies. With graph technology, people can solve the previously unsolvable. Top financial institutions, retailers and Telecoms, global governments overseeing civilian affairs, defence, and intelligence use Neo4j to analyse, optimise and protect. They have enabled customers to manage financial fraud, patient outcomes, the mission to Mars, global fare pricing and vaccine distribution.
There are many use cases in resource management, oversight, security, planning, science and education. Robin offered examples where Neo4j graph technology is commonly used in the public sector.
In the context of the pandemic, the technology is extremely competent in the tracking, isolating and vaccination processes of COVID-19. Further, it can be used for recruitment and talent management, which aligns well with the government’s priorities about being future-ready.
Before Graph Technology, connections were tabular, but with Graph technology, relationships are fleshed out for a single individual. This will impact the way teams are built. For instance, when people are put into special projects, graph data can connect and recommend the optimal combination.
In closing, Robin reminded delegates that Neo4j created the graph category and that it is a tool that can catapult organisations in their growth through faster and better-quality insights.
Levelling up business and agency outcomes through a unified AI platform

Alvin Pang, Sales Director, Asia, Dataiku spoke on how AI can be integrated into the operations and processes to solve problems and deliver results for businesses and agencies.
Dataiku is a software company that provides end-to-end data science and machine learning platforms. The company is headquartered in New York and Paris, with a regional based in Singapore for Asia operations.
“AI technology is becoming commonplace,” Alvin opines. To stand out and deliver extraordinary results, the challenge is in utilising AI at scale and deftly integrating technology, people, and processes.
The question is: How can you holistically drive a process across technology and people in a coherent manner to deliver results fast and in a sustainable manner?
Continuing with an examination of the AI maturity journey, he says as organisations peel away from the experiment stage, into the established stage and operationalise use cases, they start to encounter conflicting objectives that they need to satisfy.
Some of these objectives include choosing between giving teams freedom or company with Information Technology standards, promoting innovation across all business units while striking a balance in governance and not introducing shadow IT.
With Dataiku, organisations can have the best of both worlds by systematising AI. He is convinced that the process is about empowering people (experts, citizens, data scientists etc.), accelerating AI from months to days and governing AI lifecycles company-wide to ensure good visibility across all data assets.
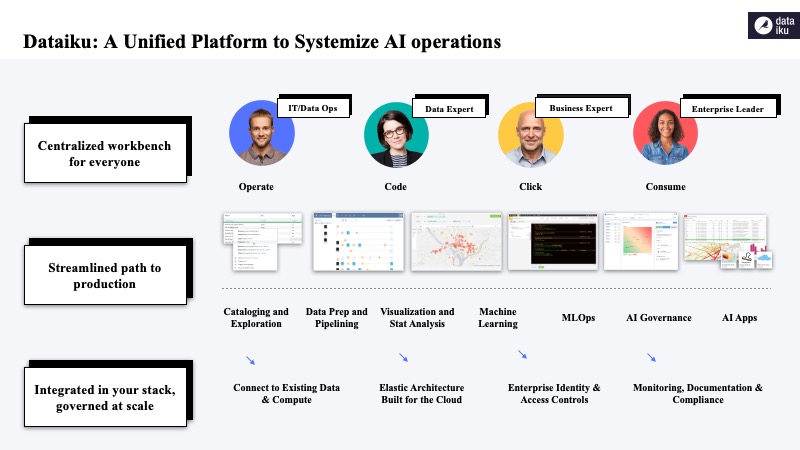
The unique value Dataiku offers is a unified platform to systematise AI operations through a centralised workbench for everyone, streamlined paths to production and integration with agencies’ stack that is governed at scale. Taken together, what Dataiku offers is the ability to drive greater collaboration at higher quality and enable good governance over data.
Dataiku would be happy to work with organisations thinking of accelerating their growth. As they have proven to drive 423% RoI over 3 years, he feels delegates would be well served to collaborate with them.
Making deep connections and elevating your work from “good” to “great”

Dr David R. Hardoon, Managing Director of Aboitiz Data Innovation and Senior Advisor, Data & Artificial Intelligence, UnionBank of the Philippines, talked about the critical nature of understanding relationships across all forms of data.
Explaining the theory of the 6 degrees of connections and David believes “everything is fundamentally situated and based on relationships and connections.”
At the moment organisations are at the point of understanding data, although more are moving to the next stage. To unlock the next level, organisations need to master the stage they are currently at.
“Connections networks and graph cuts across every field,” David asserts. Understanding someone from the underlying relationships, influence and productivity unearth the underpinning motivations and rationale people have.
This begs the question: how then, do we make those connections and leverage that information? How do we understand how to identify or detect an event using that insight?
The first step would be to focus on what organisations want to achieve, identify the “why” and work back in terms of the “how.”
For example, if the desire is to find out how to encourage people to get vaccinated, it is about working backwards to understand the type of data you need and the relationships required.
When asked about what constitutes “good” and “great,” David felt that the difference is in operationalisation. The biggest challenge is in being able to execute and turn insights into operational decisions. The work becomes great when “insights that are operational,” that is, information that forms decision support pillars that leads to implementation and execution.
His advice is to focus on how the insights are operational, “achieve greatness, then go for the good to have.” Regardless, David pointed out that organisations should not “be distracted by perfection.”
Interactive Discussions
After the informative presentations, delegates participated in interactive discussions facilitated by polling questions. This activity is designed to provide live-audience interaction, promote engagement, hear real-life experiences, and facilitate discussions that impart professional learning and development for participants.
In the first poll, delegates were asked about the most important factor in their analytics journey. Half of the delegates indicated that evolving their data infrastructure/architecture is the most important (53%). The rest of the delegates were split between the time to deliver results (13%), consolidation and digitalisation of assets (13%) and data security for data science (13%). The rest of the votes went into hiring data scientists/analysts (8%).
A delegate said knowing what data to collect and how to leverage data for policy formulation is important. We need to think about what we are trying to achieve before identifying the data sources.
For David, all the options are important but, to him, everything stems from the time to deliver. Using the banking industry as an example, he shared that the time to deliver end-to-end used to be about 8-10 months. By setting a target to reduce it to three days, all other considerations will follow, for it would involve evolving the data infrastructure in terms of requirements for security procedures.
The following question inquired on what delegates thought their organisation are at in terms of analytics or AI maturity. Most of the delegates selected self-service visualisation (37%), followed by predictive analytics (25%). The other delegates voted for the collection and consolidation of data (19%). The rest of the votes were split between dashboarding (13%) and standard reporting (6%).
A delegate remarked that while they were one of the early adopters of AI, the technology has not moved very much from that. Although they use tools in visualisation, they are lacking the ability to understand data across organisations that can help with service improvements, practical decisions, and operational decisions. He believes that users do not know what they want – they need guidance on what data to collect, how much to collect and how much personalisation.
Nuancing the position, David believes users know what they want but require conversations that bridge the different points of view to elicit firm answers.
Mohit agrees that businesses often do not know what they want. Additionally, he points out, goalposts are regularly shifting, indicating that people may have to reassess what they want.
On the challenges faced while implementing analytics or data science practice, most delegates indicated felt business and IT restrictions in delivering analytical projects/work as the main challenge (37%). The remaining votes were split between understanding where to get the data from to build a practice (19%) and understanding business needs and requirements (19%). The rest of the delegates found the lack of skillsets – proprietary language or different systems (13%), time to deliver analytics projects to production (6%) and not having enough manpower (6%) the main challenge.
One delegate expressed that their struggle lies in using data to formulate strategies. End-users must find correlation and how best to do it. The difficulty is in nailing down the policy question.
When asked about areas delegates saw their organisation expanding data science practice, most expressed that self-service analytics – citizen data scientists (57%) are the priority, followed by cyber / C3 ops (22%), data platforms and consolidation (14%) and MLOPS (7%).
On that note, David explained that he selected MLOPS because the point about using technology is not about innovation per se but turning data into an operational reality.
Regarding the biggest challenge that they faced, most delegates indicated connecting data effectively as a challenge (35%). Other delegates were equally split between drawing insights (29%) and exploring data relationships (29%). The remaining found data interpretation challenging (7%).
In the conversation on this issue, delegates spoke of other prevailing challenges such as not having a data warehouse where data can be accessed easily and the inability to explore data relationships to cross-reference to other data sources.
David pointed out that when managing data, there is rethinking to be done. Too often, organisations are collecting data that they do not need. He stated the need to “understand that data is there for specific purposes.”
Mohit added that it is about surfacing the storyline and connections in the data.
The last poll inquired about the common data Integration and connection challenges faced. Half of the delegates indicated disparate data formats and sources as the challenge that they face (50%). The rest of the votes were split between the fact that the data is not available where it needs to be (22%), other (14%), having low-quality or outdated data (7%) and having too much data (7%).
Mohit remarked that even in a smart nation like Singapore, there are challenges that affect organisations – data collection, data storage and quality of data.
David is of the view that the problem with data is people. “We have all the tools,” he remarked, “but we put limitations on ourselves.” For him, we are leveraging enough in the way that we handle data.
Agreeing with David, Mohit added that the issue might be that “people do not know what tools to use.” Organisations have too much data but are unsure of how they can harness the information to generate insights.
Conclusion
In closing, Robin expressed his gratitude towards everyone for their participation and highly energetic discussion.
Summarising the discussion, Robin pointed out that organisations need to begin with the question of what they want to achieve and link it to policy questions. That would provide clarity on what organisations want to achieve and map that outcome onto the data to be collected.
After identifying, it is about knowing where to get the data and grappling with the over-collection of data. Finally, the following question would be on finding tools and ways to cross-refer insights and links across data sets.
Robin emphasised the edge AI and Graph technology can offer organisations in their journey towards digital transformation. Complex problems required innovative solutions. Harnessing the twin capabilities of AI and Graph can boost capabilities by generating real-time information and deeper analysis.
Before ending the session, Robin echoed David in highlighting the importance of not being distracted by what organisations do not have. He urged delegates to start with what they have and operationalise the insights by connecting data and applying AI.
Mohit added, “Data is only gold if it is giving us the insights and when people have access to them.”
Reiterating that digital transformation is an ongoing and collaborative journey, Robin encouraged the delegates to connect with him and the team to explore ways forward.