Australian
Information Access Commissioners and Ombudsmen have released the inaugural dashboard of metrics on public
use of freedom of information (FOI) access rights.
In December 2016, the Australian Government announced the
finalisation of Australia’s first Open Government National Action Plan (NAP).
This included a commitment to develop uniform metrics on public use of freedom
of information (FOI) access rights (Commitment
3.2) to promote the importance of better measuring and improving understanding
of the public’s use of rights under freedom of information laws.
The NSW Information and Privacy Commission (IPC) led the
development of the metrics on behalf of and with the involvement of the
Commonwealth, state and territory Information Access Commissioners and
Ombudsmen within the remit of their jurisdictions (the Australian Association
of Information Access Commissioners – AIAC).
The metrics
are largely aligned with the World Justice Project’s
(WJP) Open Government Index, which seeks to measure government openness
based on the general public’s experiences and perceptions in 102 countries.
These metrics are expected to enable the community to
examine the performance of their local FOI laws and to advocate accordingly, as
well as improve community understanding of how FOI laws work and how to access
them.
The metrics reflect the currently available data that is
reasonably comparable across jurisdictions and the priorities agreed in
Australia’s first Open Government National Action Plan. It is noted
that while every effort has been made to provide a common baseline across jurisdictions,
the metrics cannot deliver directly comparable data between jurisdictions. The
metrics and data should be read in conjunction with the specific legislative
arrangements in each jurisdiction.
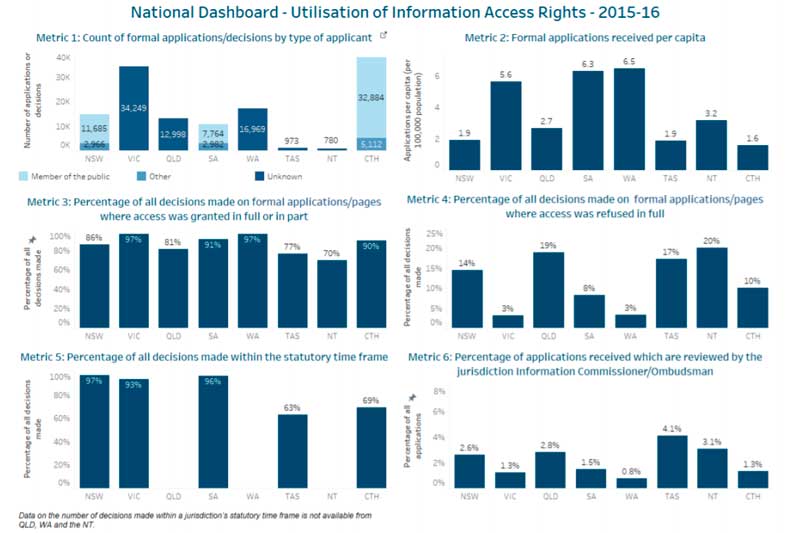
The inaugural dashboard covers data from 2014-15 and
2015-16, including:
- Count of
formal applications by type of applicant – Count of the number of
valid/formal applications for information received by all agencies is categorised
as: 1) member of the public (i.e. individuals and their legal representatives);
2) other (i.e. members of parliament, media, private businesses, not for profit
organisations, other government agencies) and unknown (not categorised) - Formal
applications received per capita – This is the count of the number of
valid, formal applications received in a financial year by agencies per 100,000
population. The count includes applications that are subsequently withdrawn o
applications or transferred to another agency and excludes applications
subsequently found to be invalid. Population
numbers are taken from The Australian Bureau of Statistics as of the end of
financial year (June). - Percentage
of decisions on formal applications where access was granted in full or part –
The generic term ‘decision’ encompasses the use of similar terms across jurisdictions
such as ‘determination’ to indicate that an agency has come to a settled position
on how an information access application received/page is processed by an agency. - Percentage
of all decisions made on formal applications where access was refused in full - Percentage
of all decisions made within the (relevant jurisdiction’s) statutory timeframes - Percentage
of applications received which are reviewed by the jurisdiction’s Information
Commissioner/Ombudsman – This is total number of external reviews received
by the Information Commissioner/Ombudsman, expressed as a percentage of all
applications received within each jurisdiction. This metric does not measure
reviews conducted internally by the agency that made the original decision, or
reviews conducted by courts or tribunals.
The dashboard will be updated each year once all
jurisdiction data has been reported.
Broad consultation on the metrics was undertaken with civil
society representatives and the general public. Respondents were generally supportive
of the metrics. Additional metrics were suggested, such as applicant
satisfaction with redaction, and fees and charges, withdrawal rates and reasons
for refusal. This feedback
is being considered in the further development of the metrics.
The press release states that some jurisdictions have moved
from a reactive or “pull model” of information release to a proactive or “push
model”. The push model requires agencies to proactively push information out to
the community, as much as possible, with the goal of making formal applications
a last resort. This difference may be reflected in the national dataset
dashboard.


