
Data is increasingly at the core of any business or organisation and is a critical raw material for intelligent analytics and the driving force behind digital transformation. Most organisations are dealing with massive amounts of data in various formats, types and across numerous systems. Their challenge is to turn that data into insights that are useful for complex decision making.
Graph technology is being seen as foundational to data management and analytics, empowering user collaboration and fostering data democratisation. With a vast amount of data, organisations need to bring a deeper layer to give them the competitive edge, insights, and knowledge. In the new normal, exploiting data and using it confidently for complex, intelligent decision-making is vital. Neo4j knowledge graphs can help as an insight for available data, enriched with semantics and revealing its complex interconnectedness.

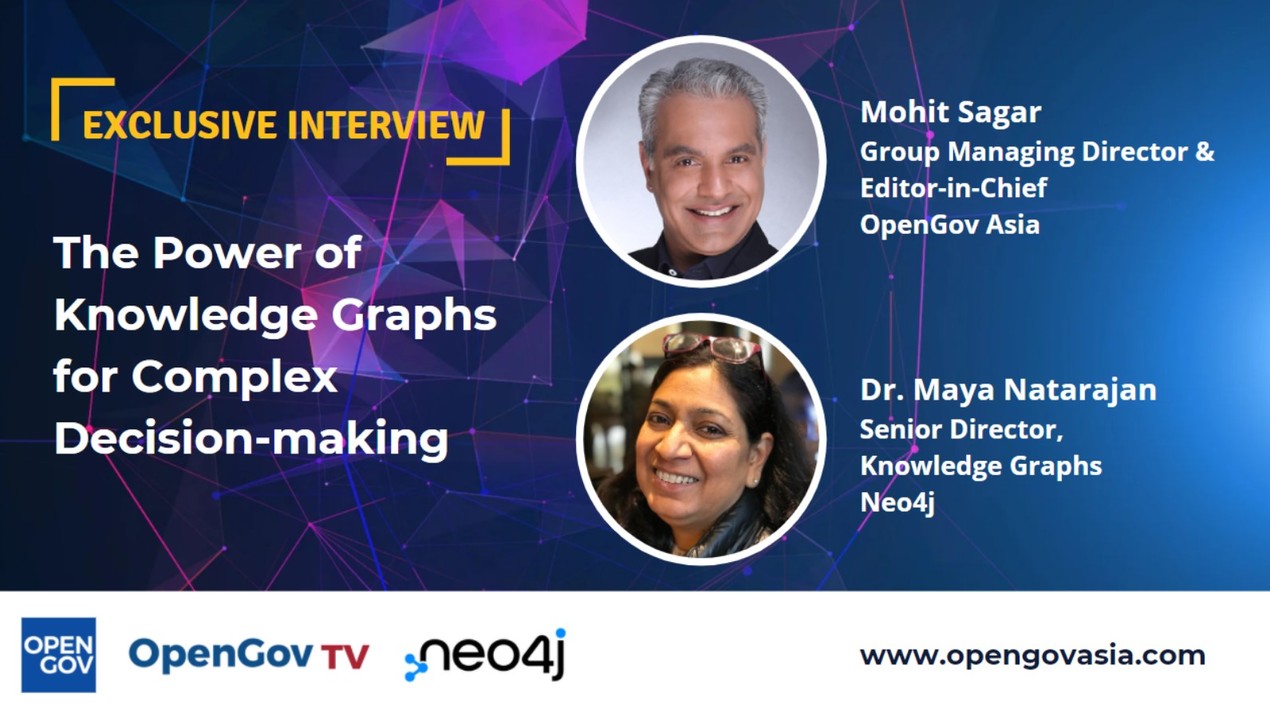
OpenGov Asia had the opportunity to speak with Dr Maya Natarajan, Senior Director, Knowledge Graphs, Neo4j to gain her insights on how organisations should utilise knowledge graphs for complex decision-making.
Maya is responsible for the go-to-market strategy for knowledge graphs at Neo4j. She is passionate about bringing different technologies together to solve complex problems and is championing the use of knowledge graphs to bring context to various systems.
She has positioned technologies from Blockchain to Predictive & User-Based Analytics to Machine Learning to Deep Learning to Search to BPM and beyond in a myriad of industries including Life Sciences, Financial Services, Supply Chain, Manufacturing, etc at various small and large companies. Maya started her career in the biotechnology area where she was in R&D focusing on cardiovascular drugs, and she has five patents to her name.
Why Knowledge Graphs are Better than Traditional Data Tools
The obvious place to start would be why should organisations move from traditional data representation and tools to knowledge graphs for complex decision-making.
Data volumes are consistently increasing – from about 40-50 zettabytes in 2019 to around 60 zettabytes in 2020 and approximately 75 zettabytes in 2021. Maya explained that as data volumes grow, organisations need to find new ways to use the massive amount of information to drive business value. Traditional analytics are no longer suitable for complex business operations and analysis.
 Traditional tools based on relational databases have existed for over 40 years and relational databases are one of the most popular query tools across businesses. Traditional analytics are suitable for transactional and straightforward data that fit easily into a relational database’s format of tables and columns.
On the other hand, graph technology focuses on the relationships between data and considers the relationship between data to be just as significant as the data itself. In OpenGov Asia’s article with Nik Vora, Vice President, Asia-Pacific, Neo4j explains that graph technology is important because it can extract the inherent value in the data itself. The purpose of the technology is to store information without restricting it to a pre-defined model.
Graph technology is the ‘most obvious approach’ to look at connections as the value of relationships itself is the underlying drive for this technology. Maya emphasises that relationships among data can be harnessed to find known and unknown patterns in data that are not identified or analysed through traditional means. What relationships bring to the table is they add dynamic context to data.
It is important, Maya says when talking about a knowledge graph, that it is defined first. A knowledge graph is an insight layer of interconnected data enriched with semantics. A knowledge graph gets richer as new data is added. Through a combination of data, graphs and semantics (meaning), organisations get a knowledge graph with deep and dynamic context.
Maya gave an example of the pharmaceutical industry to illustrate how knowledge graphs work. A pharmaceutical company will know how to get drugs in a particular therapeutic area to market – the domain knowledge that the particular pharmaceutical company has in this area is very specific and proprietary.
Knowledge graphs have three components: data, graph and semantics. Relationships are stored along with the data in a graph database, and they are important as they provide the first level of context to data. In a knowledge graph, the pharmaceutical company’s domain knowledge can be viewed as its semantics and is key as it adds a second layer of context to data. Deep dynamic context makes knowledge graphs the top choice of use for cases that require complex decision-making as context is the prerequisite to complex decisions.
Industries from supply chain to financial services to life sciences and beyond currently require complex decision-making. Hence, knowledge graphs have become the most popular choice for diverse cases.
Unique Benefits of Knowledge Graphs
Maya believes that knowledge graphs are immensely useful for organisations to solve their business challenges. Specifically, organisations should enhance their toolkit and adopt a Neo4j knowledge graph as it has two distinct benefits that other tools do not possess.
First, Maya reiterates, that semantics is one of the key components and advantages of knowledge graphs. Semantics are encoded alongside the data in the graph itself. This is how knowledge graphs drive intelligence into data and significantly enhance its value. Essentially, knowledge graphs increase the value of data through semantics by adding more context.
The second benefit is of knowledge graphs can make incumbent technologies better by providing better data management, better predictions and better innovations. Partly because knowledge graphs fuel machine learning and they can be adopted well to a variety of use cases.
How Neo4j Tailors Specific Solutions to Different Business Challenges
Knowledge graphs ease the complex process because they add or imbue intelligence to every stage of the data. However, each organisation has different business challenges and context – including its digital strategies, clients and outcomes. This begs the question: how does Neo4j tailor its solution to generate value for each organisation’s unique circumstances?
Maya explains that every organisation is identified by its domain knowledge. Knowledge graphs explicitly take domain information into account in the form of semantics. By utilising knowledge graphs, Neo4j tailors the solution for each organisation according to its domain knowledge.
She illustrates this point by sharing the example of a large global pharmaceutical company – one of Neo4j’s clients – who use knowledge graphs for analysing patient journeys. A patient journey is described as a patient experience throughout an entire episode of care, starting from the admission of the patients to their discharge.
The large global pharmaceutical company recognises that no two patient journeys are exactly the same, but they want to find places where they could improve the outcomes of patients. Complex diseases develop over years, so the company would like to intervene faster and earlier during the patients’ journey to improve outcomes. They feel they could do this by finding similarities between patients.
Using a combination of a Neo4j knowledge graph, graph algorithms and machine learning, this large pharmaceutical company identified journey archetypes and journey patterns and used those as influential touchpoints to intervene at the earliest moment in a patient journey to make the most impact. In this case, it is a knowledge graph that allowed them to customise this solution.
Below is the visualisation of a single patient and journey through their disease progression.
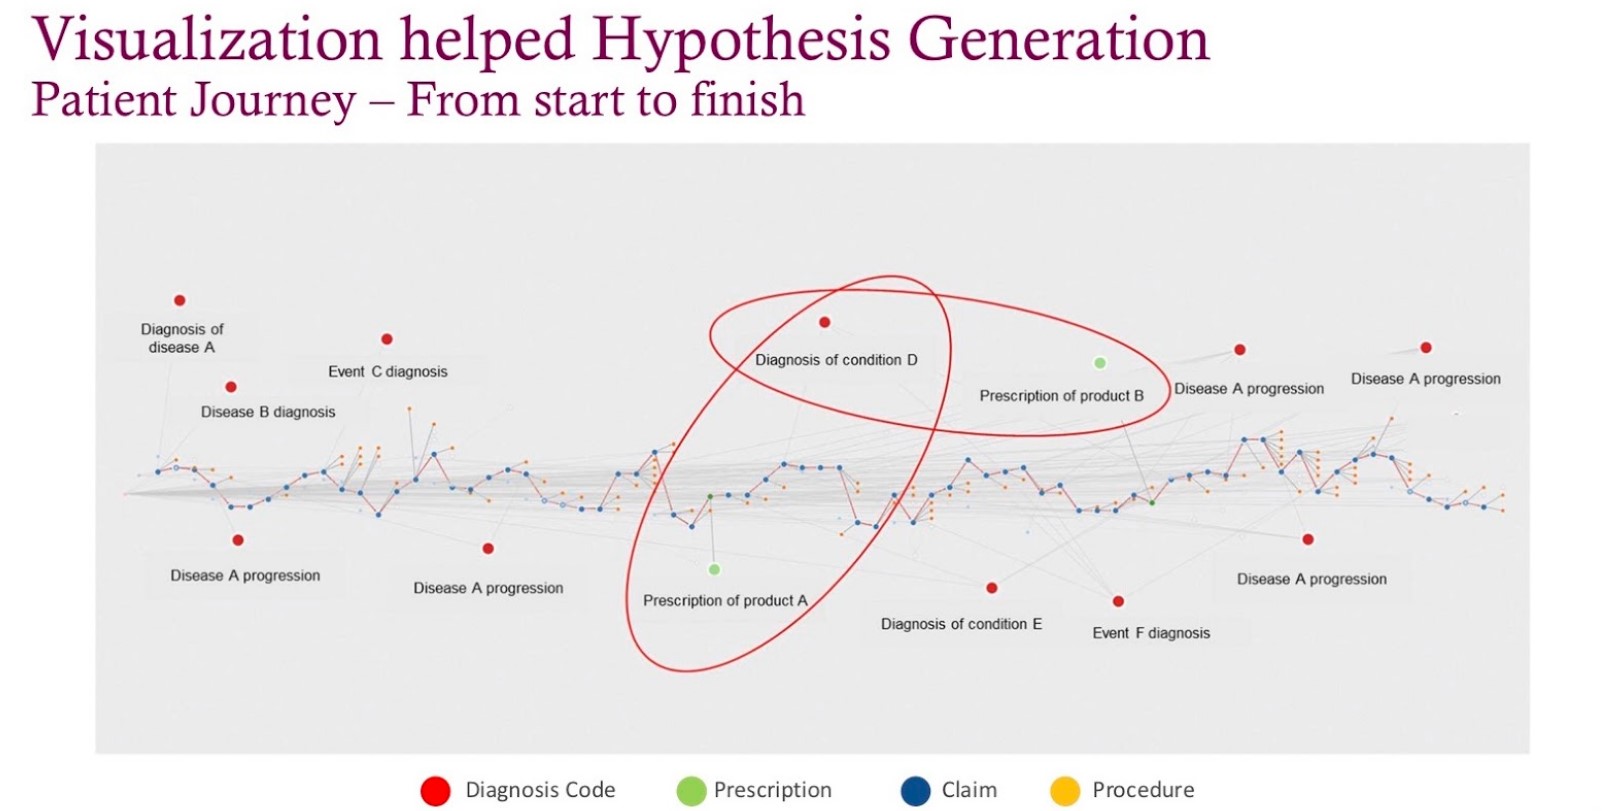 Every blue dot represents a medical claim, every red dot represents a diagnosis, and every green dot represents a prescription. When laying out this data from left to right, it became real; this data became humanised and patterns emerged. In this example, the green (prescription) dot is followed by another condition or diagnosis, after which the physician pivoted to a new prescription in response to the diagnosis that happened after the first prescription.
These kinds of patterns were exactly what this large pharmaceutical company was trying to understand within the patients, how physicians treated patients and whether their products would help these patients. In many cases, it would yield a better patient outcome. This individual visualisation became an anchoring point; it became a very different way to analyse data. The Neo4j knowledge graph helped facilitate these analyses rather rapidly.
Combining Knowledge Graphs and Artificial Intelligence
Maya agrees that the combination of knowledge graphs and Artificial Intelligence (AI) is a platform on steroids. Companies are increasingly using AI applications for decision-making. Due to a lack of contextual information, AI systems have not been able to achieve their full potential as reliable solutions for complex problems.
This is where knowledge graphs come in. They offer a logical way to capture data relationships and convey their meaning. Knowledge graphs embed intelligence into the data itself and offer AI the tools to make sense of it all – to be more explainable, accurate and repeatable. THE FUTURE OF AI: Machine Learning and Knowledge Graphs is suitable for forward-thinking organisations that are keenly aware of the power their data represents and who understand that its proper use empowers intelligent decision-making.
Recently, both knowledge graphs and AI have joined forces. The powerful combination of the two has spurred the interest in using both technologies. AI/machine learning benefits from knowledge graphs as knowledge graphs provide context in two different ways: First, knowledge graphs give data context by the addition of semantics. Second, relationships between data provide another level of context.
With knowledge graphs, data scientists get to more data in the form of relationships – by double-dipping on the data they already have and taking advantage of relationship data that they previously tossed out because it was too hard to process. Because it is built on graph technology, a knowledge graph captures relationships for analysis, so not only do data scientists have more data, but they also have more data variety.
“In Machine learning, the more data you have, the higher data quality is. The more data variety, the higher the accuracy,” Maya emphasises.
Versatile Use Case applications of Neo4j Knowledge Graphs
NASA uses Neo4j knowledge graphs to solve issues in future missions to space. While working on a mission to send Orion, a space shuttle, into space, they found that its uprighting system was not working correctly. Knowing that Apollo used a similar uprighting system to Orion, they were confident they could use the knowledge from the Apollo mission to correct this issue before Orion’s launch.
NASA deployed a knowledge graph to comb through millions of documents, reports, project data, lessons learned, scientific research, medical analysis, geospatial data and much more across departments. By using a Neo4j knowledge graph, they found a way to correct the uprighting system in Orion. Without the knowledge graph, the team would have spent years testing different designs. They saved two years of work and one million dollars of taxpayers’ money.
Standard Chartered Bank in Singapore utilises Neo4j knowledge graphs for risk management to proactively identify cybersecurity risks to protect the bank from cyber threats. As cyberattacks are on the rise, this is an important use case for the bank. Other financial services customers are also utilising knowledge graphs for the same reason.
These are very different projects that utilise Neo4j knowledge graphs. The beauty of knowledge graphs is that they lend themselves well to a range of areas across the data spectrum, from data management to data analytics. Hence, any organisation from various industries can adopt Neo4j knowledge graphs to derive actionable insights for complex-decision making.