The Indonesian government has made persistent efforts to seek advanced data interpretation solutions for decision making in areas such as law enforcement, finance and health care, among others. The efforts are in line with a national strategy for Artificial Intelligence development that the government has released in the form of a blueprint to guide the country’s AI development between 2020 and 2045.
Indonesia’s national AI strategy consists of four primary focal areas – ethics and policy, talent development, infrastructure data and industrial research innovation. Under ethics and policy, enhancing Anti-Money Laundering and Counter-Terrorist Financing initiatives is the focus for the Indonesian government to improve governance and compliance.
While graph databases technology is not new, it has been the fastest-growing technology in critical decision making. By organising data in a graph format, Graph Databases functions can overcome big and complex data challenges that standard databases cannot solve that will speed up tracking and decision making. With the power to analyse and find relationships of billions of data accurately, this technology will complement Indonesia’s national Artificial Intelligence strategy.
Graph Database technology can detect unethical practices in real-time which allows tracking transactions with multiple functions and people proofing. Detecting and eradicating unethical behaviours with Graph Database technology has been eye-opening for governments throughout the world.
Due to the growth of Graph Database technology and the simplicity of learning and application, converting and connecting data into a usable graph schema has become commonplace. Moreover, a graph model greatly improves decision-making and fraud detection processes in government operations.
Graph Databases solve problems that are both impractical and practical for relational queries. It speeds up reviewing information based on given algorithms and quickly provides evidence and alternative solutions to make decisions quickly and effectively that mitigate all fraudulent activities.
Graph Databases provide quick modelling and advanced Machine Learning methods to combat unethical behaviour. This can also lead to better detection due to the interconnected data. Real-time graph analytics can help explore, identify and forecast complicated relationships to make more accurate judgments.
Governments can opt to track location and time using the Graph Database platform. Practitioners can weight edges to explicitly link entities that are close in location or time which records time series data for fraud detection and raises red flags.
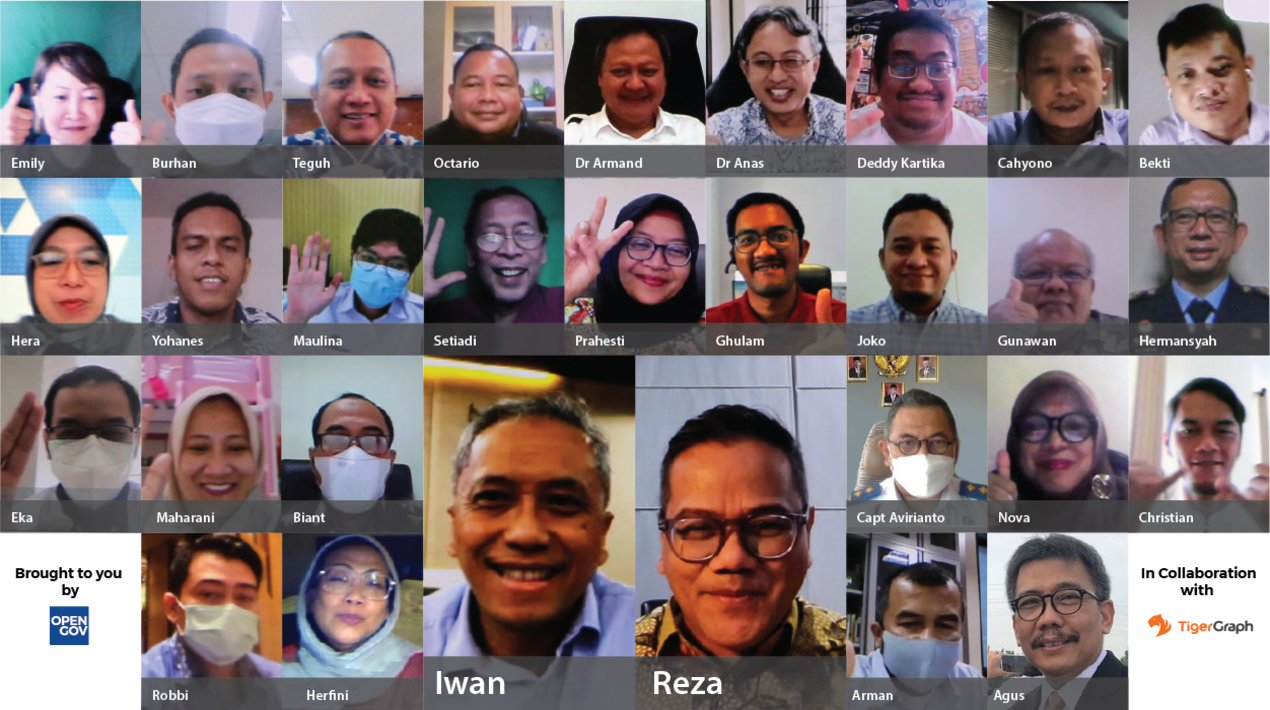
This was the focal point of the OpenGovLive! Virtual Breakfast Insight on 22 September 2021. This session aims to provide the latest information on delivering an effective method to detail evidence and practical decision-making using Graph Databases. This is a closed-door, invitation-only, interactive session with top Indonesian government institutions.
Finding Partners for Using Graph Database Technology

To kickstart the session, Mohit Sagar, Group Managing Director and Editor-in-Chief, OpenGov Asia delivered the opening address.
Mohit began emphasising the complexity of data, especially in government agencies as data is being collected in multiple ways, across various agencies for a variety of purposes. This collection has been going from the beginning, be it in structured or structured ways, all adding to the intricacies of working with data.
Further, as security is one of the biggest challenges for governments, agencies need to be aware of what goes on in the entire infrastructure.
Citizens’ expectations of governments’ digital services are continually increasing, in the normal course of time, but even more so in the backdrop of the pandemic. To a large extent, this is because the benchmark of personalised customer experience has been raised by retail outlets that use a plethora of cutting edge solutions. As a result, people are looking for more efficient digital services from all areas including the public sector.
For Mohit, Graph Database is a great and relevant technology for the public sector as the data is incredibly complex and often chaotic. While the technology has been around for 30 years, the adoption of this technology in organisations and agencies is still in its infancy. However, as data is getting immensely complicated, agencies are starting to utilise Graph Database technology increasingly.
In closing, Mohit emphasised the importance of finding the right partners to organise data using Graph Database technology. Having competent experts who can focus on analysing data to keep agencies safe and secure, allows governments to focus on their main tasks and key deliverables.
Advanced Analytics and Machine Learning on Connected Data

The forum next heard from Reza Pahlevi, Managing Director, Indonesia, TigerGraph on the benefits of using Graph Database technology for the public sector.
Reza agreed with Mohit premise that the idea of Graph Database technology has been around for a long time, but the applications are still in the beginning stage. To elaborate, he gave an example of how graph analytics work when comparing two famous people. While both have a huge following, Graph Database technology can differentiate these groups in a number of ways. For example, they can show the different types of audience that they have which results in different impacts and the way they can address each.
Over the last decade, the adoption of Graph Database became more popular. In the last two years, its popularity escalated because Indonesian agencies adapted to the recent technologies relatively quickly, ware that Graph Database could help agencies accomplish their goals.
Founded in 2012 and the headquarter in California, TigerGraph provides graph database and graph analytics software. TigerGraph is versatile and can be used across a wide range of industries, including financial, manufacturing and the public sector.
Introduced in Indonesia just over 5 months ago, the customer growth has been rapid. Agencies that adopt TigerGraph can save money and increase potential revenue over and above the three key benefits of TigerGraph – the ability to scale, high performance and convenience.
While its wide diversity covers areas from life science and cybersecurity, the adoption of Graph Database has mainly been in the financial sector as 7 of the 10 major global financial institutions use the TigerGraph platform. It has been deployed for credit card fraud, impact analysis, merchant analysis, credit scoring, trade surveillance and wealth management.
Reza elaborated on cross-industry use cases, including fraud detection, anti-money laundering solution, law enforcement specific solution and supply chain solution.
One of the largest global banks used TigerGraph for detecting fraud rings in its search for a better way to detect and remove fraudsters from their credit card network. Big-data tools and other graph technologies either could not scale to the full customer base or gave inconsistent results but prototypes had shown that a combination of advanced graph algorithms gave significant gains. By using TigerGraph, the company was able to expose fraud rings, shut down connected cards and combat fraudulent activity on a massive scale.
Another use case is a leading technology group in Southeast Asia that uses TigerGraph to combat crime and fraud. The company has a super mobile app as an exchange for many products and services including their popular ride-hailing services across Asia. They are constantly battling and trying to keep up with users of the platform attempting to defraud and cheat their consumers. The company needed a graph database technology that could quickly perform fraud-related queries/algorithms in real-time.
After comparing several graph vendors, the company selected TigerGraph because it allowed them to process their large data size and perform real-time analytics at the same time. By using TigerGraph, the company was able to combine and analyse data across entities pan-Asia and greatly increase the ability to capture fraud and provide optimisation of their ride-hauling business.
Reza was confident that organisations from various industries will adopt Graph Database technology and it will eventually become must-have technology.
Discovering the Unseen Opportunities with Graph Database

Iwan Djuniardi, Director of Information and Communications Technology Transformation at Directorate General of Taxation under the Ministry of Finance, Republic of Indonesia was the next speaker.
Iwan started by stating the goals of the Directorate General of Taxation (DGT), the Ministry of Finance, Republic of Indonesia. The DGT aims to increase revenue by broadening the taxpayer base and improving compliance. Besides revenue, services need to be consistently improved by leveraging technology. Deploying technology also leads to lower costs and greater transparency.
Iwan described the challenges that DGT face to accomplish their objectives. The first challenge is the increase in the system load that will continue into the future. At present, the number of taxpayers in Indonesia is around 40 million and the number is expected to be 70 million in 2030.
Another challenge is the behaviour changes of taxpayers that will be dominated by millennials. Historically, DGT, like many government agencies, did not have a strong citizen-centric outlook. The organisation’s culture will have to change and they will need to adapt services according to what citizens want.
The last challenge is administrative which includes risk management, skill and expertise gaps, and poor data quality.
After laying out the challenges, Iwan explained how deploying Graph Database helped. By using the technology, DGT can collect data from various sources, both internal and external. The analysis allows them to identify, investigate and escalate the tax revenue potential. Graph Database enables them to implement an information administration system with single case management and a method of predictive analytics based on risk assessment.
Iwan elaborated with the use case of Data analysis of Badan Penyelenggara Jaminan Sosial Kesehatan (BPJS) or Social Health Insurance Administration Body. BPJS owns some information related to the number of employees working in Indonesia and the amount of BPJS fees paid by companies. DGT has some information related to the number of employees and total salaries. Using tax invoices as input, big data can dig up some inter-data correlation, especially for transfer pricing prevention. Each transaction pool can be mapped, clarifying the transfer pricing indication.
In closing, Iwan reiterated the key points of his presentation. Graph Analytics big data is highly effective, accurate and reliable, allowing the speedy achievement of DGT’s revenue target as well as revealing tax fraud and tax avoidance issues. Overall, Graph Database technology helps achieve DGT’S key objectives.
TigerGraph Live Demo
After speakers’ presentations, Ghulam Imaduddin, Director, Solution Engineering at TigerGraph did a live demo on how to use Graph Database technology. He displayed the TigerGraph dashboard for the management of fraud. There are total alert cases that come from the algorithm that TigerGraph implements in Graph Databases plus a feature of ‘location’ which is important for fraud prevention. Agencies can view the summary and recommendations as well as recorded cases and, if necessary, can customise all the features for specific needs.
Ghulam went on to explain how to create alerts and follow cases. By using TigerGraph, agencies can know and track all the cases from the beginning, showing show things that trigger transactions. Agencies can customise the criteria and priority in creating alerts. TigerGraph already provides the algorithm for any kind of criteria, from basic to advance, so agencies can utilise that easily.
Interactive Discussion
After the informative presentations, delegates participated in interactive discussions facilitated by polling questions. This session is designed to provide live-audience interaction, promote engagement, hear real-life experiences and impart professional learning and development for the participants. It is an opportunity for delegates to gain insight from subject matter experts, share their stories and take back strategies that can be implemented in their organisations.
The first question asked whether delegates are familiar with the advantages of Graph Database and how they will enhance their daily decision-making process. Almost half (43%) said that they are familiar but currently have not implemented this technology. A little more than one-third are not familiar and have not implemented this technology while about a fifth (19%) are currently using it.
A delegate from the Indonesian Ministry of National Development Planning said Graph Databases are important and will be beneficial in informing policies, but unfortunately, at present, her organisation has not adopted this technology.
Reza believed that Graph Database technology will be the future technology that many agencies adopt, not just for fraud detection, but in other areas. Iwan added that in taxes, there was a lot of modus operandi for fraud. Sometimes the ambiguity of the regulations allows bad actors to find a loophole to commit fraud.
The second question inquired about how the current usage of graphs in delegates’ organisations. Almost half (46%) acknowledge they use graphs to a limited extent, especially in the initial phase of exploring how graph could be of value. Almost one-third (31%) used graphs in several projects but not at the production level and not on a large scale. Almost one-fourth (23%) used graphs in a small way and had some understanding of how graphs work.
A delegate asked whether the data has to be well-constructed to use Graph Database. Ghulam clarified that the data did not need to be well-managed. In fact, one of the benefits of TigerGraph is data management – agencies can have raw data with few connections and TigerGraph can link the data and make predictions.
On being asked about how they see that graph can be valuable to them, a little more than one-third (37%) chose a 3600 view of the customer. Delegates were equally divided (25%) between identity graph and supply chain while 13% chose fraud or money laundering.
A delegate from the Ministry of Law and Human Rights asked if Graph Database could be deployed to determining disharmony or inconsistencies in regulations. Iwan explained with the example how his company used Neuro-Linguistic Programming to find out why his organisation kept losing in court. The technology revealed that the reason why kept losing was due to the inconsistencies in the regulations.
Participants were polled on what tool they use to detect early fraud detection and fraud prevention with higher quality alerts that find suspicious activities. Almost two-thirds (69%) did not have any tool to alert or detect suspicious activity while one-third said the tool they use was not a real-time one.
The last question asked whether they are ready for Industry 5.0 to provide insights and scale their business. A little more than one-third (34%) said they were ready to a limited extent (in the initial phase of exploring how graph can be of value). Almost a quarter (24%) have some understanding (small scale usage) of how graph works. Delegates were equally split (18%) between using in several projects but not at the production level (not on large scale) and use graph at the enterprise level but and curious to find out more about scalability, distributed (advanced users/clients).
On being asked by Mohit about what agencies should do as the first step, Ghulam said that agencies only needed to prepare the kinds of data they have. He emphasises that the data do not have to be complex or geo-spatial although it is better to have simple connected data using any relevant criteria.
Conclusion
The Virtual Insight concluded with remarks from Reza Pahlevi. As technology gets more sophisticated, agencies need to be adaptive and adopt advanced technologies to accomplish their goals, including Graph Databases technology. In the future, Reza felt many organisations and agencies will move to Graph Databases as the technology is proven to be efficient increase performance.
Before bringing the session to an end, Reza thanked everyone for their active participation and the key insights shared. He encouraged the delegates to exchange ideas and gain more information about Graph Databases.
